
Charts can be an effective means of visualizing and sharing complex information with others. However, the process of creating graphics can often be challenging and time-consuming, particularly for individuals lacking programming or design skills. With this in mind, we would like to introduce you to Graphy—an online tool designed to simplify creating and sharing graphs from your data, requiring just a few clicks.
Graphy is the best solution for creating and sharing graphics on the Internet
Graphy is a user-friendly tool that enables you to design and share data-driven graphs. The platform is completely free to use and does not require any registration.
One of the key advantages is that you can create graphics directly in your web browser (Chrome, Firefox, Edge, Safari, etc.) without the need for any installations on your computer. This allows you to access Graphy from anywhere and on almost any device.
It’s worth noting that while we tested Graphy on both Android and iPhone devices, the mobile version is not yet optimized for use. However, it is possible that this will be addressed in a future update.
Despite this minor limitation, Graphy offers a modern and intuitive interface. You can access a table to enter the data you wish to include in your chart. Additionally, you can paste data from sources such as Excel tables or Google Sheets documents. You will see a real-time preview of yo as you input your data.
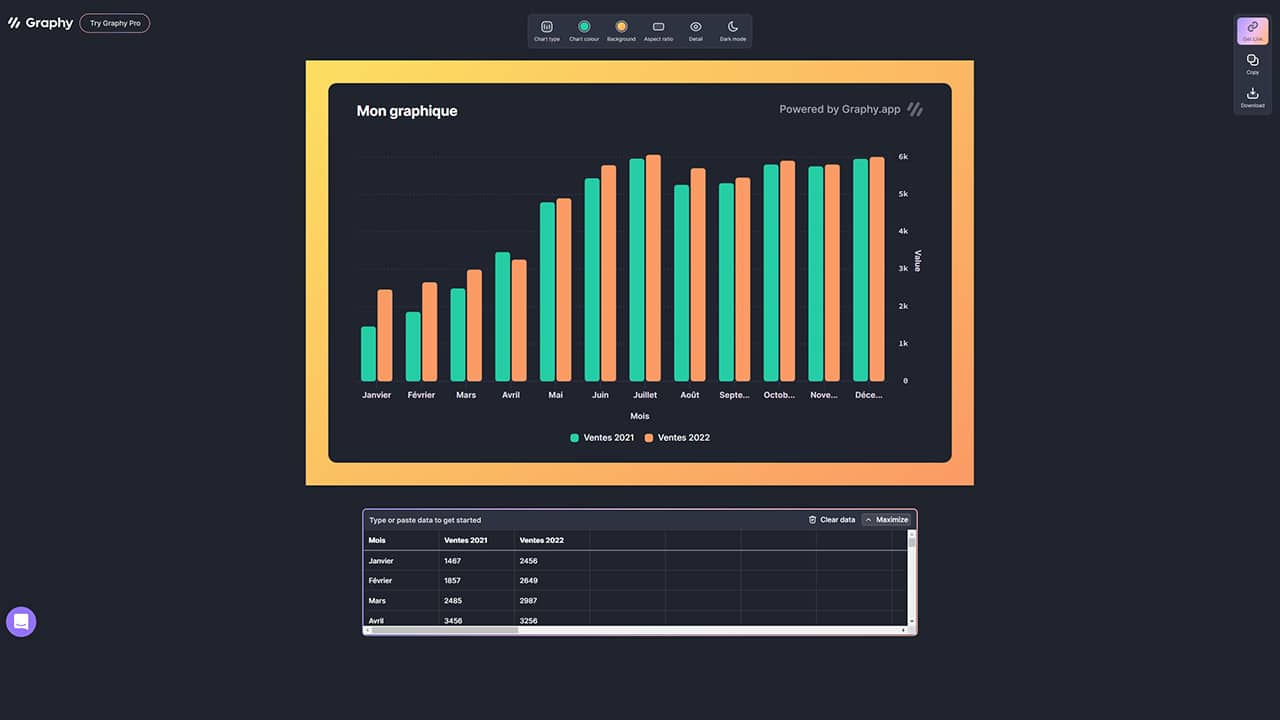
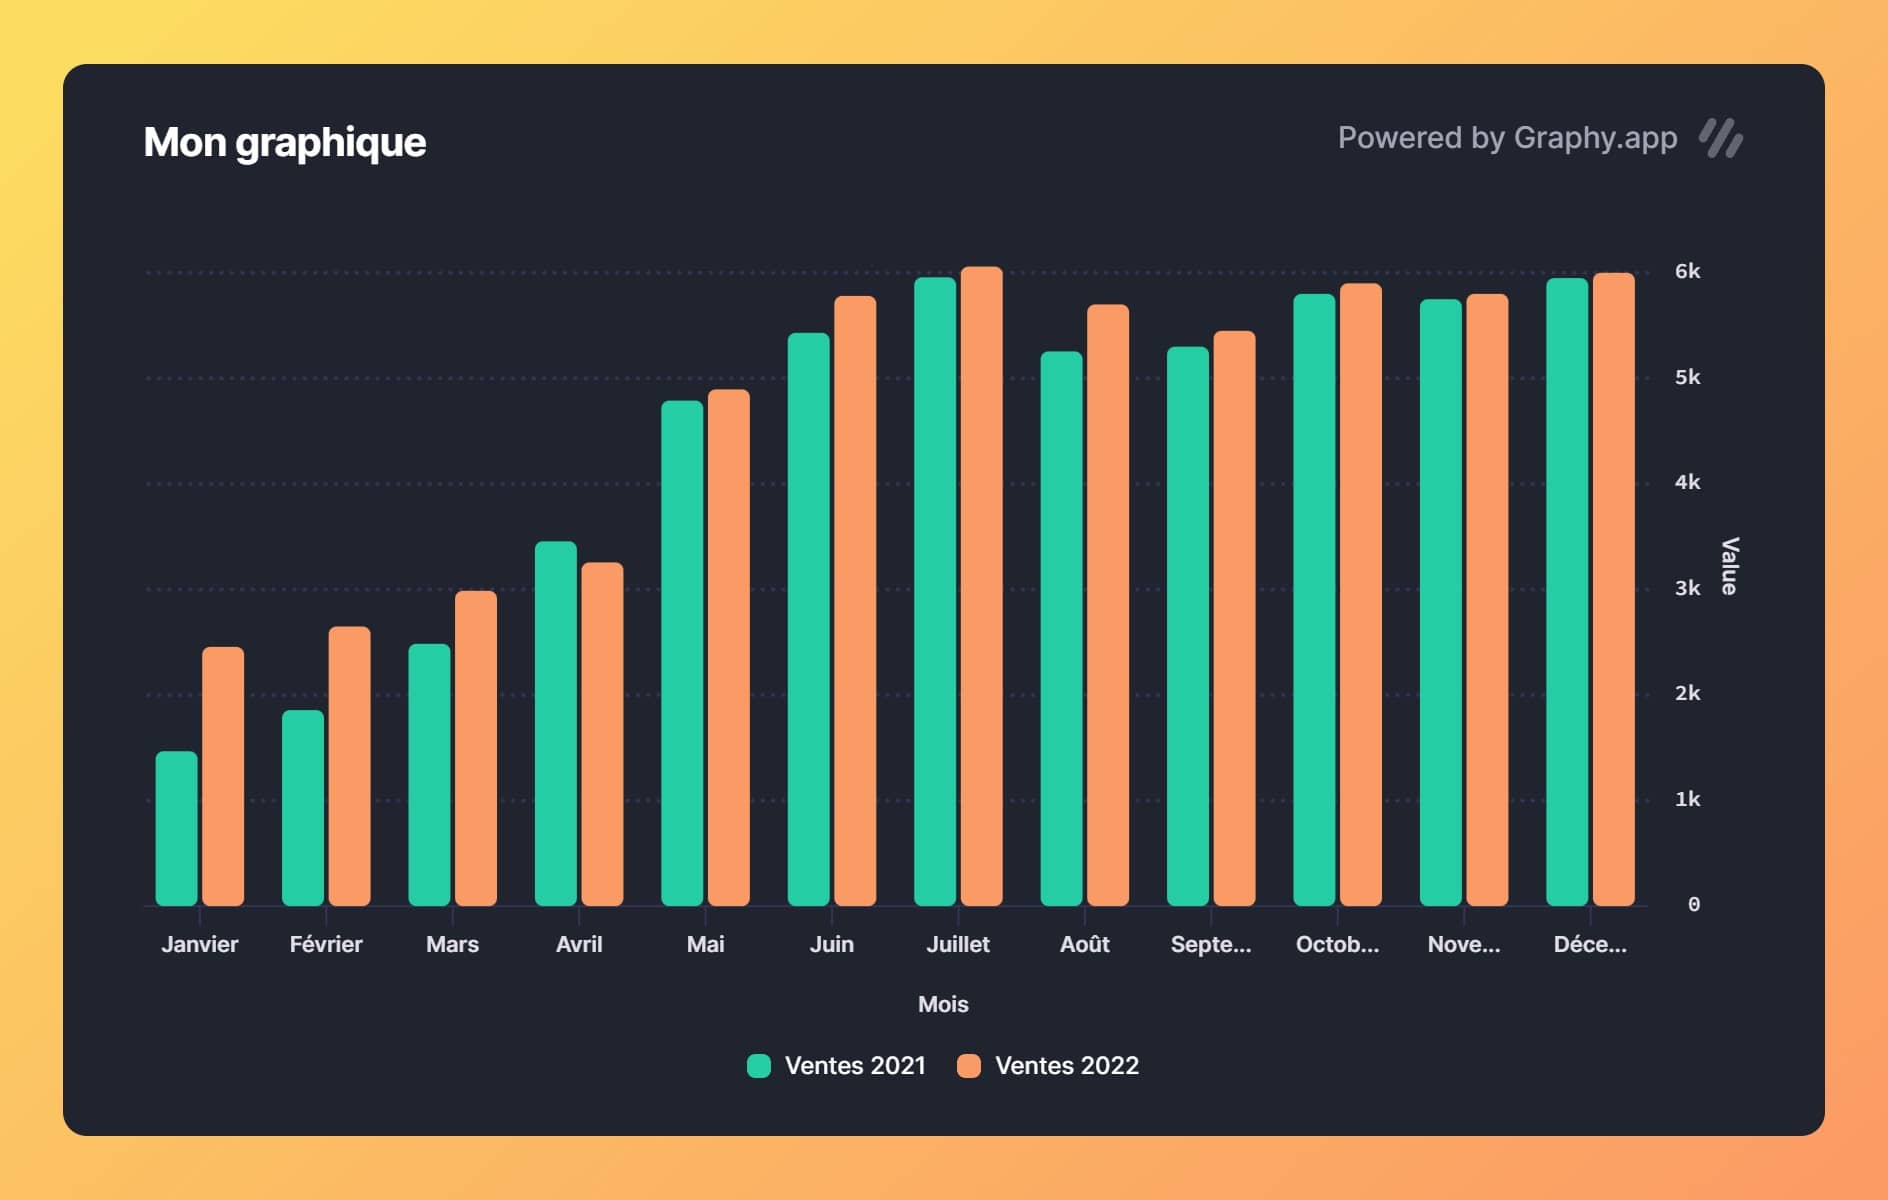
Customize your chart as you see fit.
To enhance the attractiveness and readability of your graph, Graphy provides a range of compelling customization options. Firstly, you can select the type of chart you prefer, such as a bar chart, pie chart, line chart, and more.
Graphy also allows you to personalize the colors of the data and background, ensuring the chart aligns with your visual preferences. Furthermore, you can specify a title for your chart, providing context and clarity.
Moreover, Graphy offers the flexibility to adjust the aspect ratio, allowing you to modify the height and width of the graphic to suit your specific requirements. This ensures that the graph fits well within your intended presentation or publication.
Download and share your chart for free.
Once you have completed designing your graph, you can download it in PNG format. Simply click the “Download” button at the top right of the window, and the graph will be saved as an image file on your device.
Additionally, Graphy allows you to easily copy your chart to the clipboard. By clicking the “Copy” button, you can swiftly capture the chart and paste it into any application or save it for later use. This provides a convenient way to transfer or utilize the graph in various contexts.
Lastly, Graphy allows you to share your graph through a simple link (URL) with specific individuals of your choosing. This feature benefits collaborative work and allows others to easily access and view the graph. It’s important to note that utilizing this option requires a valid email address, ensuring that the sharing process remains secure and controlled.
In conclusion, Graphy proves to be a valuable tool for individuals seeking to visually represent their data. Its user-friendly interface and robust features enable users to create visually appealing graphics effortlessly. With customization options, convenient download capabilities, and easy sharing functionality, Graphy becomes an indispensable tool for collaboration and presentation. Don’t hesitate any longer; explore the advantages of Graphy today! If you know other similar tools, feel free to share them in the comments section. Happy graphing!
Did you like this article? Do not hesitate to share it on social networks and subscribe to Tech To Geek on Google News to not miss any articles!"Because of the Google update, I, like many other blogs, lost a lot of traffic."
Join the Newsletter
Please, subscribe to get our latest content by email.